


Forecasting Markets In May: Breaking of the Wheel
"I'm not going to stop the wheel. I'm going to break the wheel." Daenerys Targaryen in Game of Thrones, Season 5, Episode 8 ("Hardhome")


The Wheel In Mythology
In symbolic mythology, the wheel is a potent archetype representing cyclical time, fate, and even a cosmic order across cultures. Often depicted as the Wheel of Fortune in Western traditions, it symbolizes the unpredictable turns of destiny, where individuals rise and fall under divine or cosmic influence, as seen in medieval tarot and Boethius’ Consolation of Philosophy. In Eastern traditions, the Buddhist Dharmachakra, or Wheel of Dharma, embodies the cycle of birth, death, and rebirth (samsara), with its spokes representing the Noble Eightfold Path to liberation. Similarly, in Hindu and Jain cosmology, the wheel signifies the eternal recurrence of time and karma.
Across these myths, the wheel encapsulates both the inevitability of change and the potential for transcendence, reflecting humanity’s quest to navigate or break free from repetitive cycles. Breaking the wheel then in some sense signifies disrupting these cycles to create some lasting change.
Today in America systems are being challenged in particular the post war economic model and consensus. The effort is nothing short of a full attempt to achieve a breaking of the wheel an outcome which will go far beyond the rise and fall of the market in the USA and impact social, economic and culture for some time to come.
This attempted change though is causing upheaval in the financial markets and as a result April has been extremely volatile. This will continue to reverberate into May giving little respite to those of us who have found the market challenging.
Armstrong Cycles, Turning Points and Roadmap
Armstrong provides a useful cycle framework even though the Turning Points are not expected to be exact and may be slightly off by some weeks in certain cases. As can be seen there is a low expected early June which is close to the Jupiter-Saturn Square occurring 15 June 2025. Many will see this as a significant negative but I believe that around this date we will have the best buy point of the year.

In the April Forecast, I expected the market to start a rising phase from around the first week of the month which would continue until 21-25th April but possibly overshoot until May 7th. The market has been much more volatile than I expected and various cycles have been impacted.
The current roadmap suggests a more modest rise into May which may now be pushed slightly further out until around 23rd May and then a less severe down phase into the middle to end of June between 15-23. From this point until at least the end of July to the first week of August there should be a significant rally.
Cycles constantly expand, contract and shift between other more prominent cycles. As such it is really important to have a technique to determine when a cycle has failed or shifted out in some way particularly in this environment. Hurst, Bressert, and many others all have methods to do this but you should find your own technique.
The Wheel and Karma
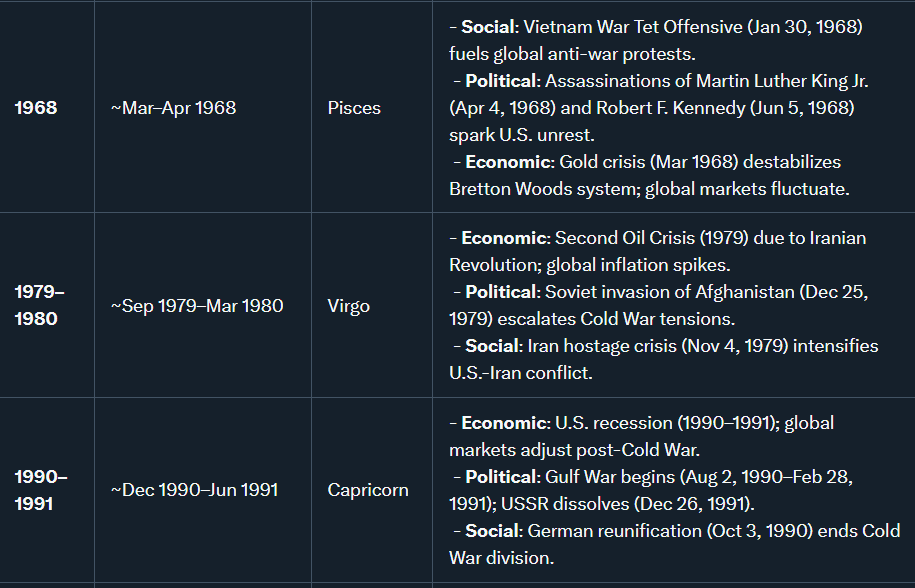
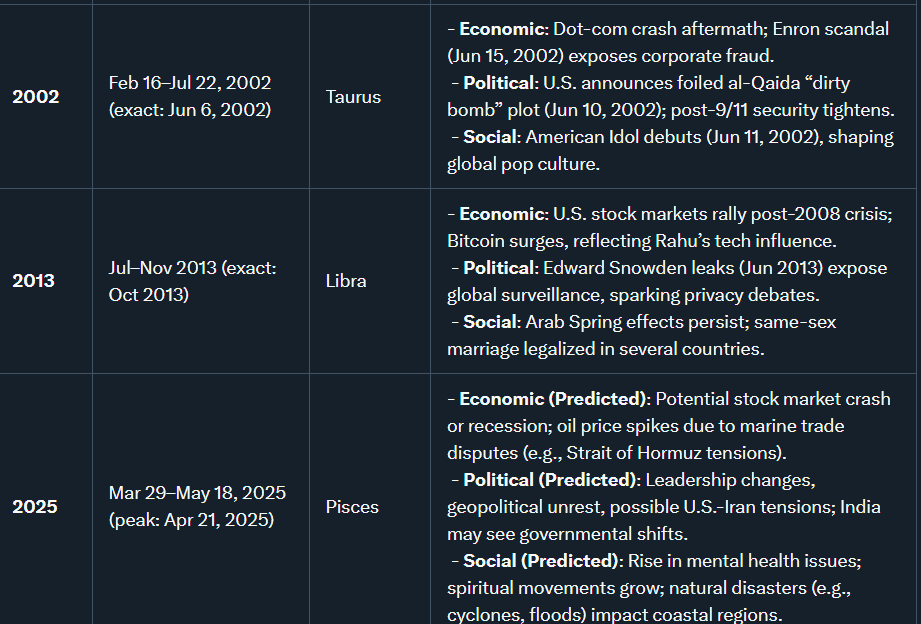
As described above the Wheel symbolizes the eternal recurrence of time and karma and the attempt to break free of the same. This is prescient as the impact of Saturn-Rahu conjunct alignment is frequently associated with karmic themes due to the nature of both planets: Saturn represents discipline, structure, and karmic lessons, while Rahu, the north node of the Moon, symbolizes desire, illusion, and sudden changes. When conjunct, every 11/12 years, these planets create a Shaapit Yoga (cursed yoga) or Pishacha Yoga, which is believed to activate deep-seated karmic patterns.
In financial astrology this combination:

If we take the dates of this occurrence in recent times.
May Markets and Volatility
Weekly $SPX
As shown above, there is evidence to say that the previous cycle in Pisces is repeating although leading into 1969. In fact, as I mentioned below there are some remarkable socio/economic and astrological similarities currently. Below I have set out the weekly chart in the $SPX which shows a rise into the early part of May.

Daily $SPX

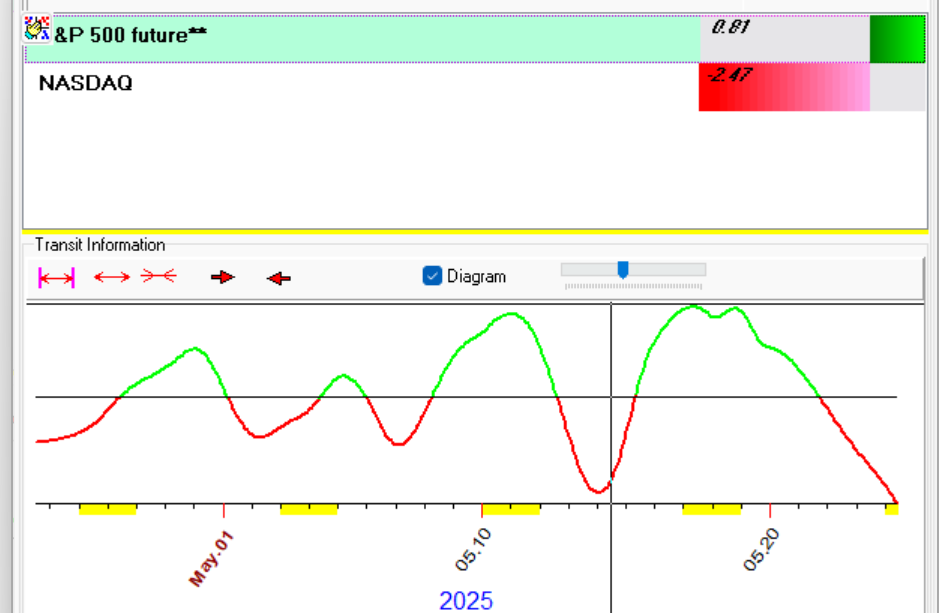
The Daily $SPX shows you should expect the month to be volatile again. Below is my private Neural Net Model which I use for Turning Points within a day or so rather than for peaks and troughs.

In the next chart you get a better idea of the volatile nature of the month although bear in mind the calculation here is from April so ignore the percentage gain or loss from the algorithm.
UPDATED 5 MAY 5th. Finally, the updated WEEKLY chart which reduces the noise shows the levels I now expect in the coming two weeks after a strong close above the Previous Month VAL and POC. If we stay above the March 3 Previous Month POC price will seek out the Previous Month VAH. In between we have the 200DMA as resistance. Previous Month VAL is key support giving a wide range but clearly defined levels.

$NDX
If the $SPX is leading the 1968 analogue in the 11/12 year cycle the $NDX is following a similar 11/12 path at a later date, in this case lagging into 2001 rather than 2002. Like the period in 1968-9 the period in 2001-2 was equally a volatile period. It appears May is also setting up to be a choppy month and I have set out some charts below.
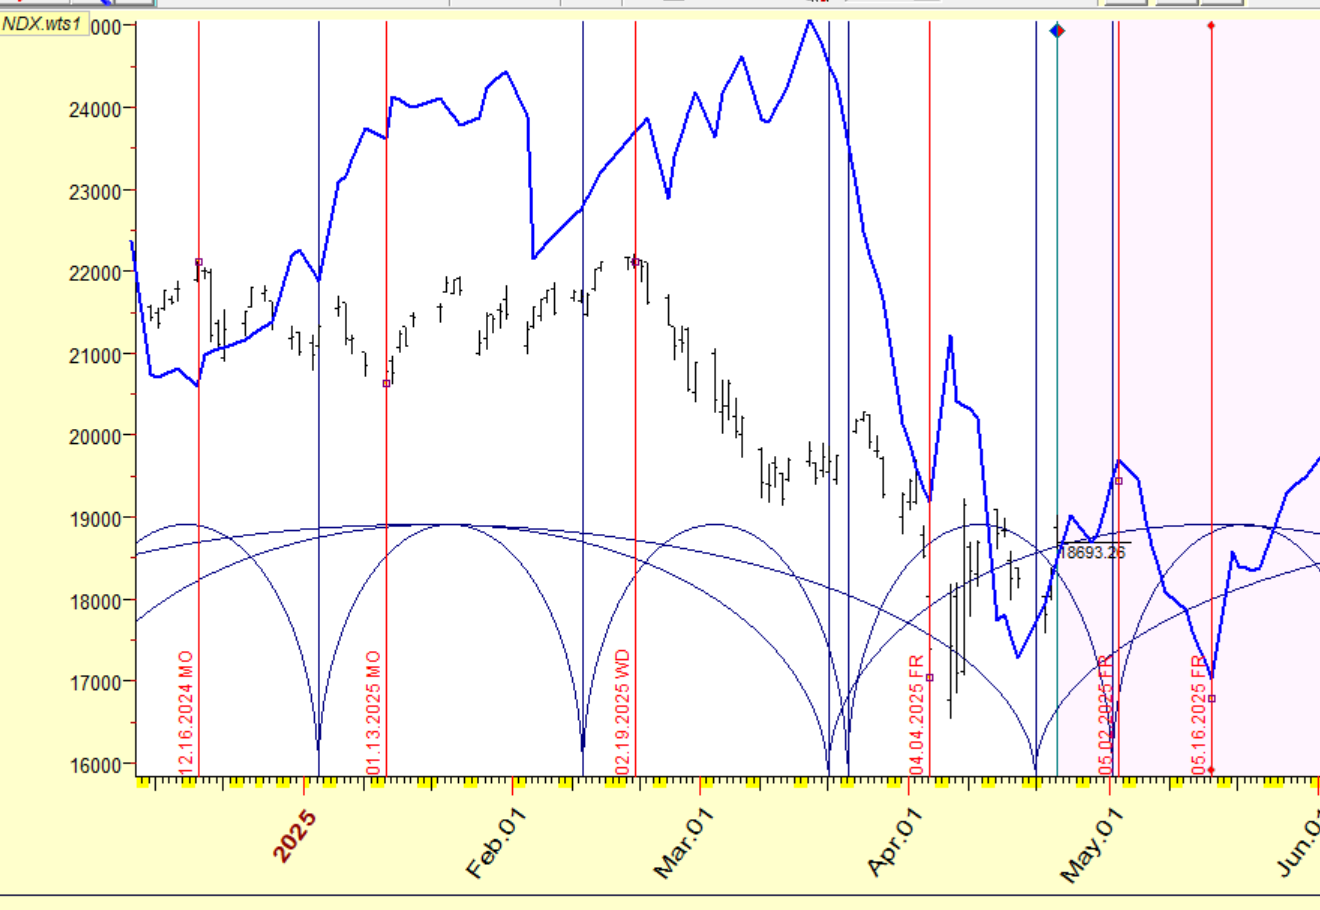
This is my Neural Net Model and it again shows multiple turning points which will make ST trading very difficult.

I have added a further chart below to show the volatility expected but again be aware the algorithm is calculated from dates in April so ignore the percentage gain and loss.

UPDATED 5TH May . Finally, in the updated WEEKLY chart below, as with $SPX, we have seen a stronger close with price seeking out Previous Month VAH and Previous Month VAL as support. In between we have 200DMA as resistance providing a wide range but clearly defined levels to watch.

$ DJIA
Returning to the 1960's analogue I have added the $DJIA. This is useful as it has a lot of available historical data and as it is interesting to show in terms of current dates as we have a repeat of the Wood Snake. I shall let you choose or not to research the significance of the Wood Snake although on X.com I have pointed out historically that this is not an optimum time for Chinese Stocks. I would only add that the symbology is of transformation, growth and expansion, of calculation, strategy and of ups and downs. This is a time of great change and it is being reflected and echoed across time and through history as vibrations and cycles available if you only listen and take notice.

UPDATED CHARTS:
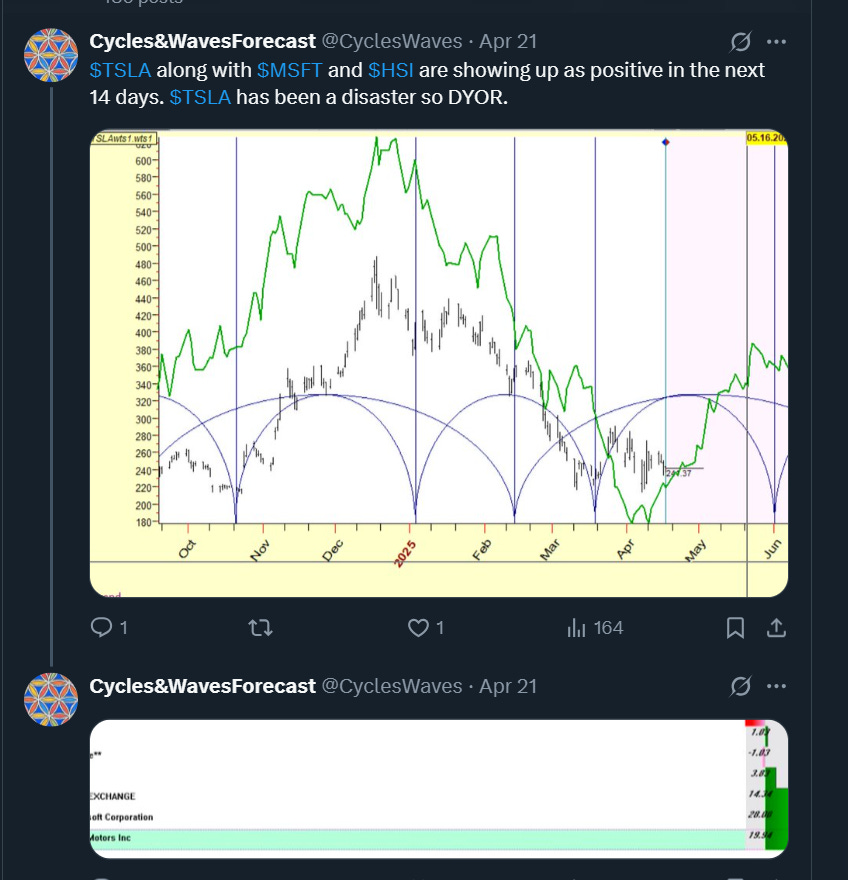
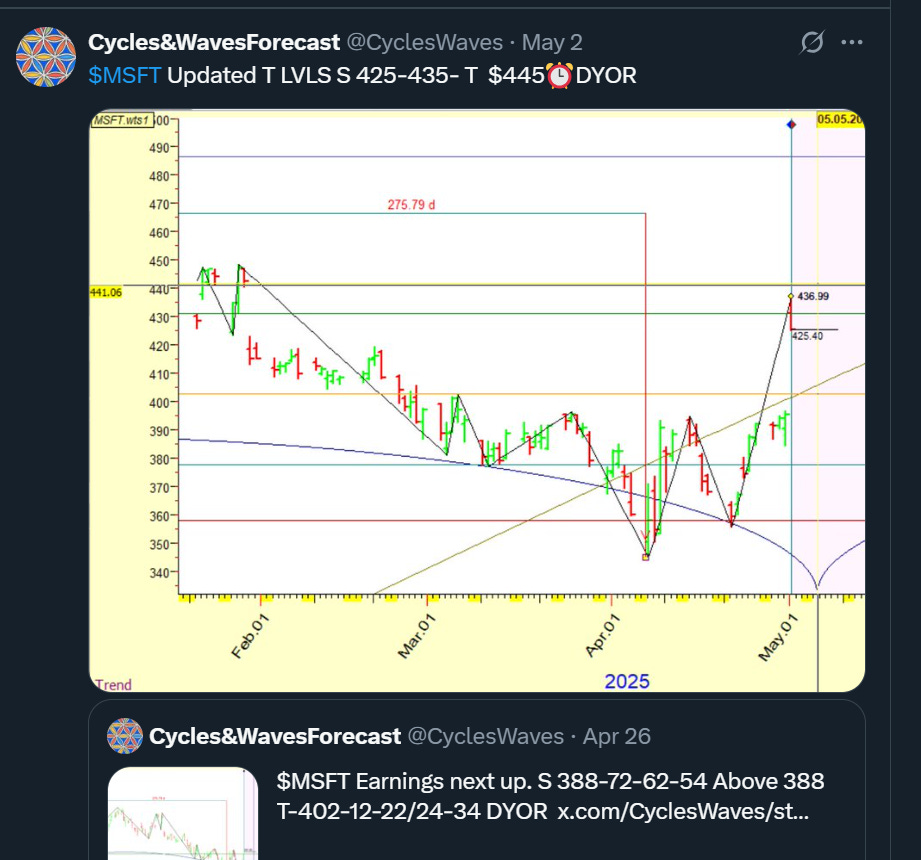
$TSLA, $MSFT, $AMZN. As usual some worked better than others.
$ MSFT A clear earnings winner.
$ AMZN

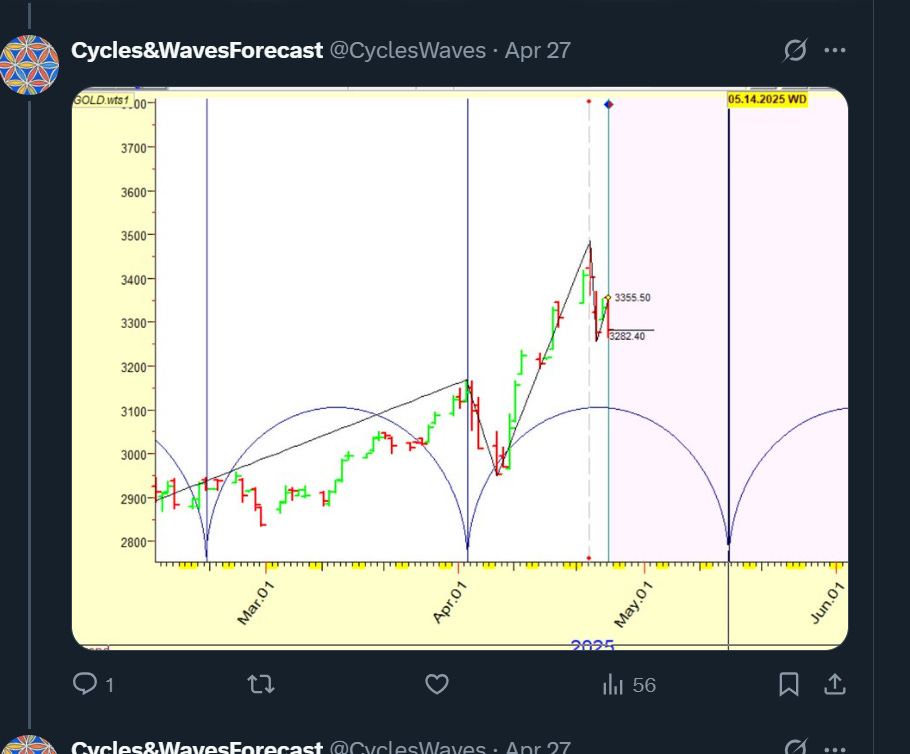
Correction in $GLD $GC,

Conclusion
It is now unlikely we will see a new high in May. I expect the market to try and stage a brief rally fail and then try again into the end of May at which point the market should turn into a down phase into the middle of June. This may be less violent and I cannot now be sure we retest the lows. I can be sure though of further volatility and a better buy point in June.
Potential Turning Points (TP) for May: 8,12*, 16, 22(DOWN) 25.
Dates not marked as UP or DOWN are more NEUTRAL and minor. Starred dates are significant and/or cluster dates.
UPDATED 04/25
Disclaimer: Do your own research. The content provided is intended for educational and informational purposes only. It should not be construed as any form of advice. I am not a financial advisor and do not accept any loss or liability for any damage or loss you may incur. Take appropriate independent financial advice suitable for your own circumstances before making any investment decision. Be a responsible person and take responsibility for your life and your decisions.